


Ask a buyer how reliable a supplier is and you will usually get an average: “they quote 30 days and they come in around 32.” That number is almost useless. A supplier whose actual lead times run 28, 29, 30, 31 and 32 days and a supplier whose actuals run 18, 22, 30, 38 and 52 days can both average 30 – and they require completely different planning. The first can be trusted with a tight replenishment cycle. The second will produce a stockout and an overstock in the same quarter.
The difference between them is variance, and variance is the number worth tracking. It is also the number nobody records, because it needs one extra spreadsheet column and a habit of filling it in.
Average Versus Spread: Why Both Matter
Lead time has two properties that affect planning differently. The average determines how early you must order. The spread – how far actuals scatter around that average – determines how much safety stock you must hold. A supplier with a low average and high spread is more expensive to plan against than one with a slightly higher average and almost no spread, because buffer inventory is priced off the spread, not the mean.
This is why on-time delivery percentages mislead too. A supplier hitting the quoted date 85 percent of the time sounds acceptable until you learn the misses are not 2-day misses but 3-week ones. Track the average, the spread and the worst case separately; each answers a different planning question.
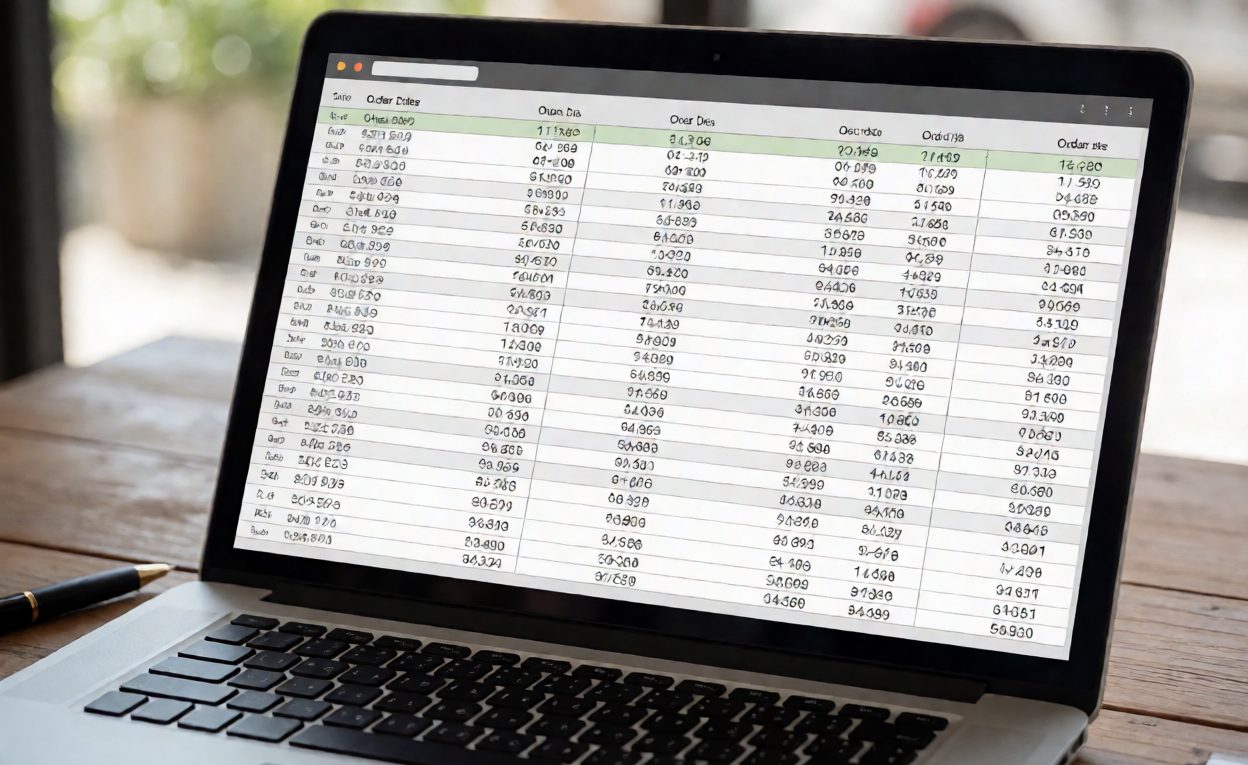
The Tracking Table
One row per delivered order, six columns, updated at goods receipt:
- Order reference and supplier. The grouping key; everything below is analysed per supplier, not globally.
- Date purchase order confirmed. The clock starts when the order is live and the deposit clears, not when you requested a quote.
- Quoted lead time in days, as stated on the order.
- Actual lead time in days, from confirmation to goods received at your dock, not to vessel departure.
- Variance: actual minus quoted, signed. Consistently negative variance is a signal too.
- Cause code. Production delay, material shortage, documentation, freight, customs – a variance without a cause cannot be fixed.
Ten completed orders per supplier is enough to start drawing conclusions; twenty is enough to act on. Below five, any number is noise.

Turning Variance Into Numbers You Can Plan With
Once you have twenty rows, three derived figures do the work. The mean variance tells you whether the quote is systematically optimistic – if the mean is plus 6 days, the quoted lead time is really 6 days longer than advertised, and you should simply plan on the adjusted figure. The spread, measured as a standard deviation, tells you how much buffer to hold. And the worst case, plus a margin, tells you what to promise customers when the order is large enough that a miss is unacceptable.
A practical sizing rule: set safety stock days at roughly the standard deviation of lead time multiplied by a service factor, then add the mean bias. If a supplier averages 4 days late with a spread of 9 days, planning on the quoted lead time plus 13 days covers most outcomes, while planning on the quoted figure alone guarantees intermittent stockouts. The buffer is not waste – it is the price of that supplier’s inconsistency, and it should be visible as a number rather than felt as a surprise.

What to Do With the Numbers
Variance data is only useful if it changes behaviour. Four uses are worth building into routine:
- Per-supplier planning parameters. Each supplier gets its own adjusted lead time and buffer instead of one global assumption, which is the single largest improvement available to most reorder calculations.
- Cause-based fixes. If most variance is documentation or customs rather than production, the fix is a paperwork change, not a supplier change – and it is usually cheaper.
- Contract terms. Suppliers with a stable, low spread can be offered more volume or better payment terms in exchange for a committed date; chronic high-variance suppliers can be asked to accept a late-delivery remedy.
- Segmentation. Put fast-moving, high-margin SKUs with the lowest-variance supplier and leave experimental volume with the cheap-but-unstable one.
Delivery reliability is one axis of the broader vendor assessment set out in supplier scorecard metrics, and variance is the metric that makes the scorecard honest rather than impressionistic. The customer-facing symptom of untracked variance is the familiar late-order complaint analysed in why orders arrive late, where most root causes trace back to a lead time assumption nobody revisited. Once variance is quantified, the buffer it implies feeds directly into preventing stockouts without holding inventory, and the planning risk it creates during peak season is covered in holiday season production priority.
Antecedentes técnicos
The quantity being measured is tiempo de entrega, the elapsed period between placing an order and receiving it, and the reason it is quoted as a figure rather than a distribution is convention rather than accuracy. The spread around that figure is measured as standard deviation, which is what converts “usually about 30 days” into a defensible buffer. Plotting variance per order over time, with limits around the mean, is control chart practice, and its value here is the same as in manufacturing: it distinguishes a supplier having a bad week from a supplier whose process has shifted.
Preguntas Frecuentes
What is supplier lead time variance?
The difference between a supplier’s quoted lead time and the actual time to delivery, tracked per order. It matters because the spread around the average drives how much safety stock you need.
How many orders before the numbers are meaningful?
Around ten completed orders to start seeing a pattern, and twenty before adjusting planning parameters. Below five, any figure is noise.
Should I measure to shipment or to arrival?
To arrival at your dock or warehouse. Measuring to vessel departure hides the customs and inland legs, which are often where the variance actually sits.
What if a supplier is consistently early?
Treat it as a signal too. Consistent early delivery usually means the quote is padded, so renegotiate the lead time downward and free up the cash tied to the buffer.
How do I convert variance into safety stock?
Size the buffer at roughly the standard deviation of lead time times a service factor, then add the mean lateness. Planning on the quoted figure alone guarantees intermittent stockouts.
Can I ask a supplier to commit to a delivery date?
Yes, particularly if their variance is low. Stable suppliers will often accept a committed date or a modest late-delivery remedy in exchange for volume or better payment terms.
Is a high-variance supplier always a bad supplier?
Not necessarily. Check the cause codes first: if the variance is documentation or customs rather than production, the fix is usually a process change and the supplier may be worth keeping.